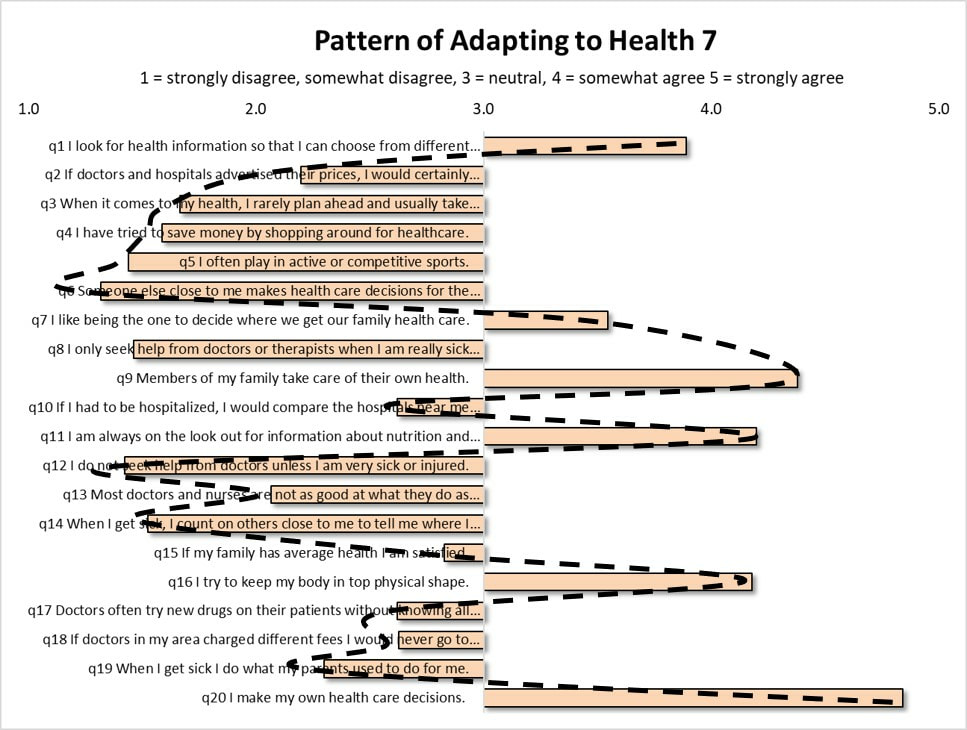
 Are we really able to choose to improve our health? How much can we really change our behavior in order to get healthy? The assumption of many government initiatives to improve health is that individuals are able to choose to change their health-related behavior in ways that positively affect their health. Looking on a case by case basis, some people can and do change. Some obese individuals are able to change their eating behavior and lose weight. Some individuals with Type 2 diabetes can improve their self-management of the condition leading to better health outcomes. Some individuals do increase their levels of physical activity to improve health. The truth is, unfortunately, the majority of individuals do not change. They remain adherent to the same behaviors and habits regardless of down-stream harm to health. Why? Non-conscious Constraints on Health-Related Behavior. Data collected over the past twenty years has consistently shown that the health-related behavior of adults conforms to a stable system of patterns. Within the United States, the same system of patterns is found no matter where you look. The patterns are found across all adult age groups, ethnic, and socio-economic segments. For example, about 13% of adults consistently conform to the pattern in the figure below, called Pattern of Adapting to Health (PATH) 7. The key thing to note about this pattern is that those adults who conform to it do so without their knowledge. This fact is extremely relevant to health. Here's why. As adult health-related behaviors conform to this pattern at increasing levels, rates of diagnosed disease increase, demand for prescription drugs increase, and overall medical expenditures levels increase. The presence of this PATH 7 pattern of health-related behavior among adults is associated with many of the worst health outcomes and costs. While an individual may be able to change one or two health-related behaviors, he or she is not able to change or resist the health effects of these larger patterns underlying behavior for one simple reason: the patterns operate outside of conscious awareness. The patterns influence health non-consciously. Basically, no one knows their health-related behavior is conforming to a pattern. The bottom line. As people exercise their free will around health, health behavior is nonetheless constrained to a pattern that can generate its own diverse impacts on health outside the knowledge of each individual. This underscores a major flaw in government initiatives seeking to promote positive health behavior change; namely, the assumption that individuals: 1) know what behaviors to change, and 2) how to change them? In the case of these patterns of adapting to health, three issues must be resolved to make headway: first, what hidden pattern of health-behavior is any given individual following; second, are the dominant health impacts associated with this pattern positive or negative, and third, how do these individuals go about changing the pattern they follow, if that is even possible?
1 Comment
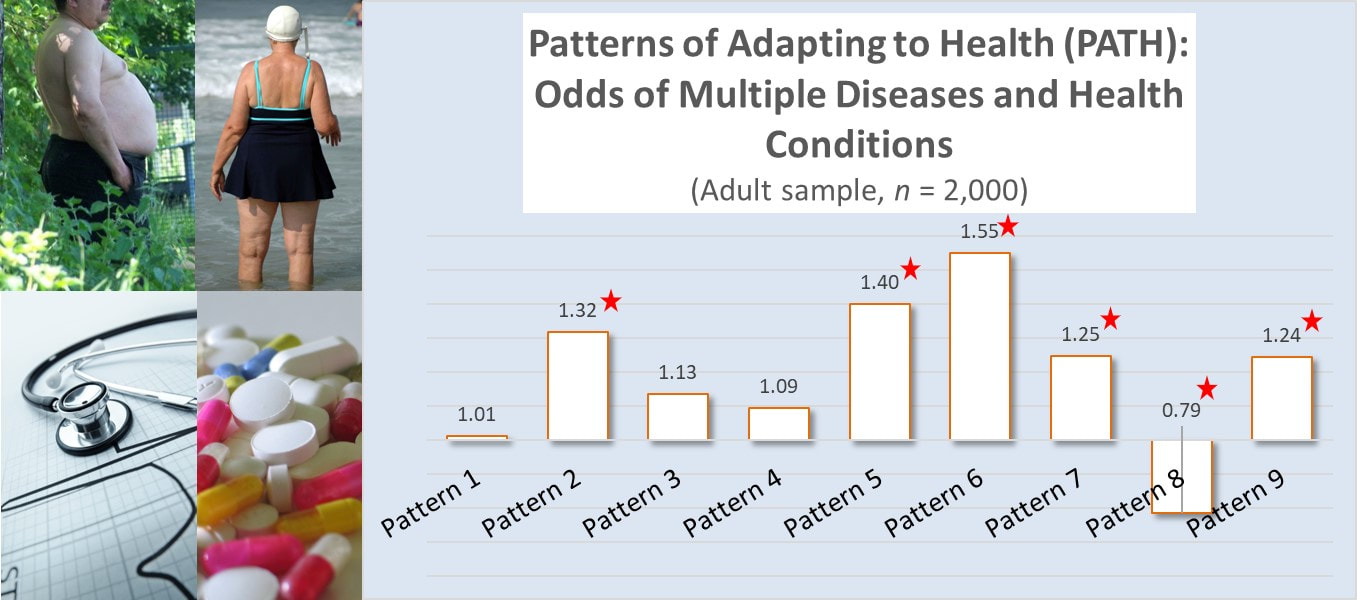
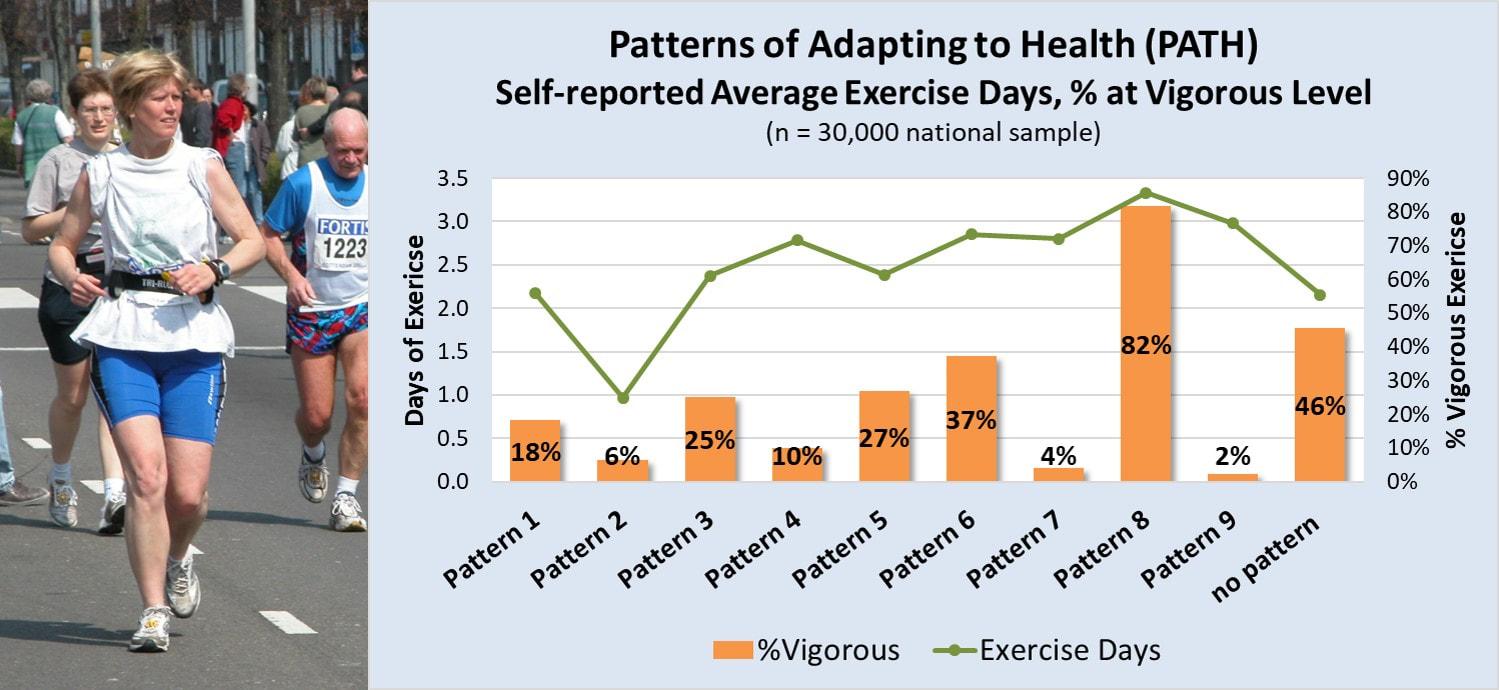 Vigorous Physical Activity and Health. Regular vigorous exercise delivers more health and heart benefits than moderate level exercise (ref). According to the Physical Activity Guidelines for adults, vigorous physical activity can deliver the same health benefits as moderate level physical activity in half the time (ref). Yet, according to HHS, over 80% of adults don't meet any of the the physical activity guidelines (ref). So, who are the less than 20% of adults who DO meet or exceed the physical activity guidelines. Patterns of Adapting to Health (PATH) and Physical Activity. The Patterns of Adapting to Health (PATH) are nine quantifiable patterns of health-related behavior that exist in every region of the United States and govern the health behavior of large adult populations. These patterns, first discovered in the mid-1980s and tracked for the past 30 years, have consistently and reliably predicted a broad array of health-related outcomes, including levels of individual physical activity. For example, in a sample of 30,000 adults from across the U.S., an adult’s dominant PATH predicted both the number of days he or she exercised and the degree that exercise was at the vigorous, most health-promoting level. Adults dominated by Pattern 8, accounting for about 11% of adults, not only exercised more frequently than adults dominated by any other PATH, they also exercised nearly exclusively at the vigorous level. In contrast, adults dominated by Patterns 4, 7, and 9 reported nearly the same average days of exercise, but very rarely at the vigorous level. So, of the nearly 20% of adults who meet the Physical Activity Guidelines, those dominated by Pattern 8 accounted for over half of them. The smattering of the rest mostly came from Patterns 3, 5, and 6. Anti-Aging Benefits: Absence of Disease. Higher rates of engaging in rigorous or vigorous physical activity have been linked to anti-aging benefits such as increased longevity (ref) and lower rates of many different types of diseases (ref). We should therefore expect to see lower rates of illness among those adults who regularly engage in vigorous physical activity the most. In a recent on line survey of 2,000 adults that included information to examine them by their dominant PATH, this is exactly what was found. The survey asks adults to identify if they suffered from one or more of the following health conditions: diabetes Type 2, high cholesterol, GI problems, chronic back, greater than 20 lbs. overweight, joint pain, muscle pain, high blood sugar, high blood pressure, low energy, mood swings, sleeplessness, or emotional stress. The number of reported disease or health conditions were compared against the participant's dominant PATH and risk odds calculated, after controlling for age. The results were as expected. Adults who followed Pattern 8 were the only ones with statistically significant lower odds of suffering from any health condition or disease. In contrast, adults conforming to Patterns 2, 5, 6, 7, and 9 had statistically significant higher odds of suffering from multiple health conditions, while adults following Patterns 1, 3, and 4 suffered from disease or health issues at a rate consistent with the general sample. Consistent with other research, higher levels of regular vigorous physical activity deliver the most health benefits and reduce the impact of aging on disease risk.
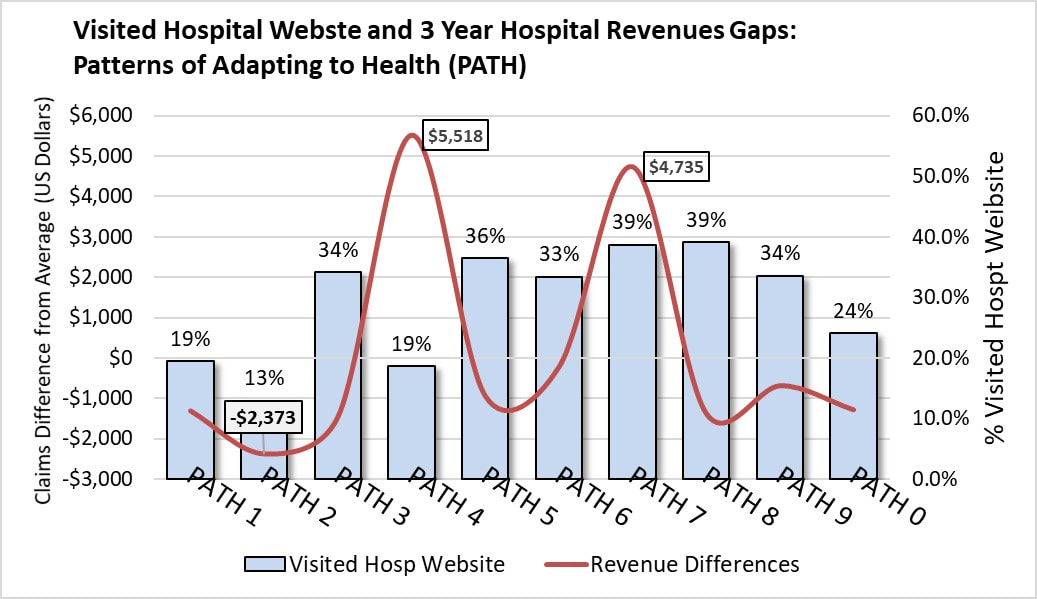
More importantly, perhaps, is the realization that a specific pattern of health-related behavior, followed by a relatively fixed number of adults, accounts for the majority of those meeting the U.S. physical activity guidelines and reaping the associated health benefits. 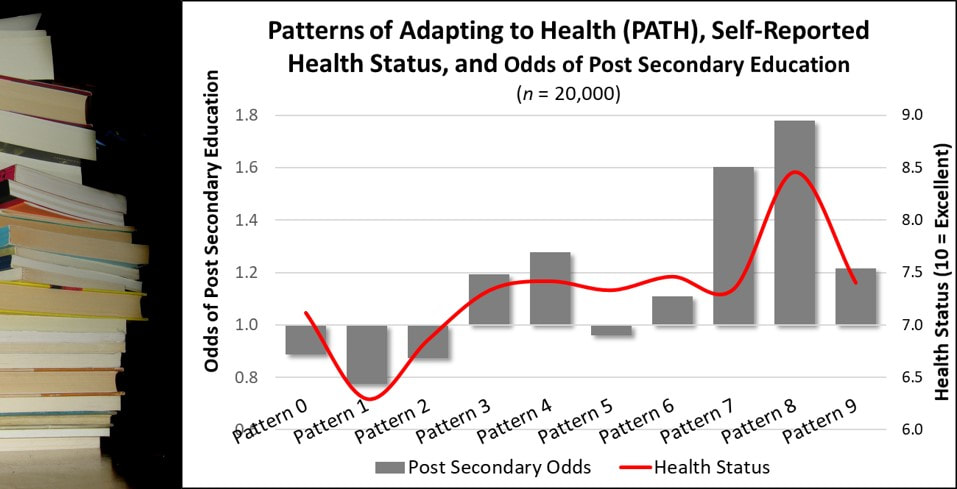 Education is a social determinant of health. Higher educational attainment, particularly post secondary education, is associated with better health. But is that the whole story? Maybe not. Patterns of Adapting to Health and Health Status. In a sample of over 20,000 adults, those with Pattern 8 reported the highest health status (red line in graph), well above adults dominated by any other PATH after controlling for educational level. Patterns of Adapting to Health (PATH) and Achieving Post Secondary Education. In the same sample, the Patterns of Adapting to Health significantly predicted the odds of achieving post secondary education, with adults dominated by Pattern 7 and the high health status Pattern 8 adults showing the highest odds. Conclusion. Improved health associated with achieving higher education may be partially explained by the greater frequency of Pattern 8 adults among those reporting post secondary education experience. Implications. The strength of education as a social determinant of health needs further study. It may, in fact, benefit from the naturally higher health status of adults with Pattern 8 more frequently pursue and achieve higher education.  A 2012 national web-based survey of 1,900 adults found that 32% reported visiting a hospital website in the past year. Question: Are all these website visitors of equal value to hospitals in terms of revenue generation? To provide one answer, the hospital website visit data and actual hospital claims data was examined in relation to the Pattern of Adapting to Health (PATH). The hospital claims data came from health plan facility claims tracked for three years against the member’s dominant PATH. The facility claims were expressed in 2017 dollars in amounts below or above the overall average claims. Adults dominated by six PATH had higher than average hospital website visits. Among these, only adults dominated by PATH 7 delivered higher value to hospitals in terms of billable insurance claims totaling $4,500 above the average per discharge over three years. Adults dominated by PATH 4 also brought in more patient care revenues but did so with below average hospital website visits. Adults dominated by every other PATH, even those reporting higher hospital website visits (PATH 3, 5, 6 and 8) generated below average hospital revenues.
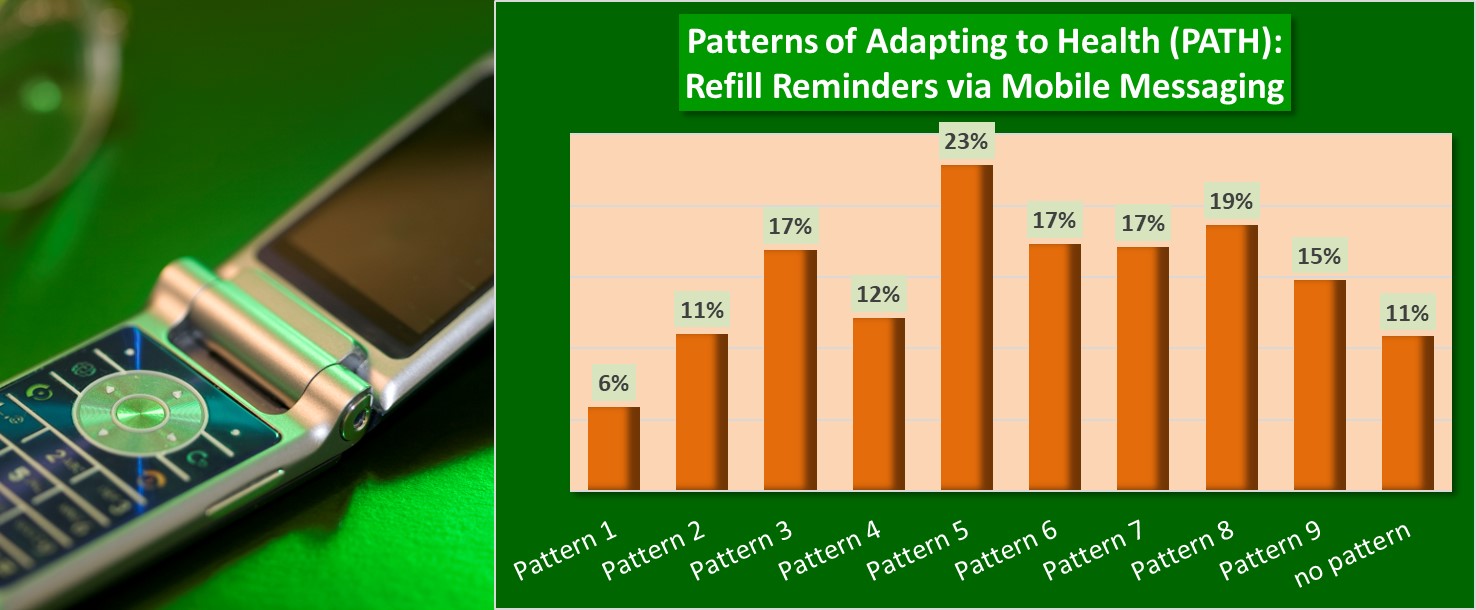
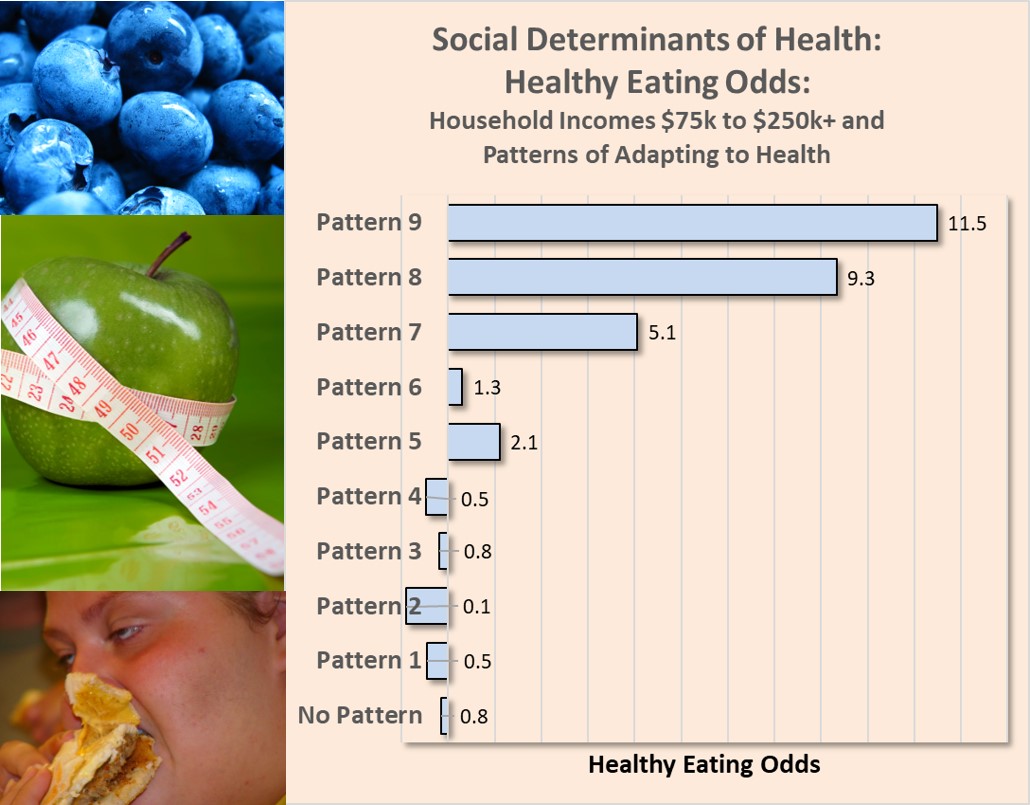
Answer: It appears, based on this quick review, that all hospital website visitors cannot be considered equal in terms of their actual revenue value to hospitals. The availability of smart phone apps to help patients stay adherent to prescription medications is a sign of the hope placed in these apps by both pharma and providers to keep patients on their medications. Yet, how many patients actually want to receive prescription reminders on their smart phones? A 2012 national survey of nearly 2,000 adults provided an answer. Among these adults, 17% responded "yes" to receiving prescription drug reminders on their smart phones. So, less than a fifth of adults would use such apps. But, that's not the end of the story. An adult’s dominant “pattern of adapting to health” was a factor shaping their interest in receiving prescription refill reminders sent to their mobile phone. As many as 23% of adults dominated by Pattern 5 expressed interest in getting such reminders. In contrast, adults dominated by Patterns 1 and 9 expressed the lowest interest at 6% and 11%, respectively. While mobile messaging reminders have been shown improve oral medication adherence, their usefulness as an adherence tool is relatively low based on patient interest, which is further likely to vary based on the dominant PATH of a patient. Income and Healthy Eating. In a prior post, a sample of over 2,000 adult interviews showed a clear relationship between increasing household income and higher odds of healthy eating. This relationship, supported by many other studies, has identified income as a social determinant of health.
The truth is…well, not quite. Healthy Eating within Higher Income Households. Looking at the odds of healthy eating within higher income households ($75,000 to over $250,000 per year), the Patterns of Adapting to Health (PATH) identified healthy eating odds contrary to expectations. In fact, variation in the odds of healthy eating among adults in higher income households were significantly impacted by the health behavior patterns of those adults. Higher odds of healthy eating were primarily driven by three PATH (Patterns 7, 8, and 9). In contrast, household members conforming to Patterns 1, 2, 3, and 4 actually showed lower odds of healthy eating, in spite of coming from higher income households. Beyond Social Determinants. Key point: Analysis of health differences across social determinants are likely to mask the true behavioral drivers in operation. It is just as likely that adult conformity to certain naturally occurring patterns of adapting to health drive them to seek social situations and environments that support the expression and goals of their underlying pattern. The conformity of adult health behavior to identifiable patterns may explain more variation in health than explained by social determinants. #health #diet #income #socialdeterminant #healthbehavior #patternofhealth Dieting is the most frequently promoted method for losing weight. Just count the number of Jenny-Craig, Nutrisystem, or other diet product commercials on any given day!
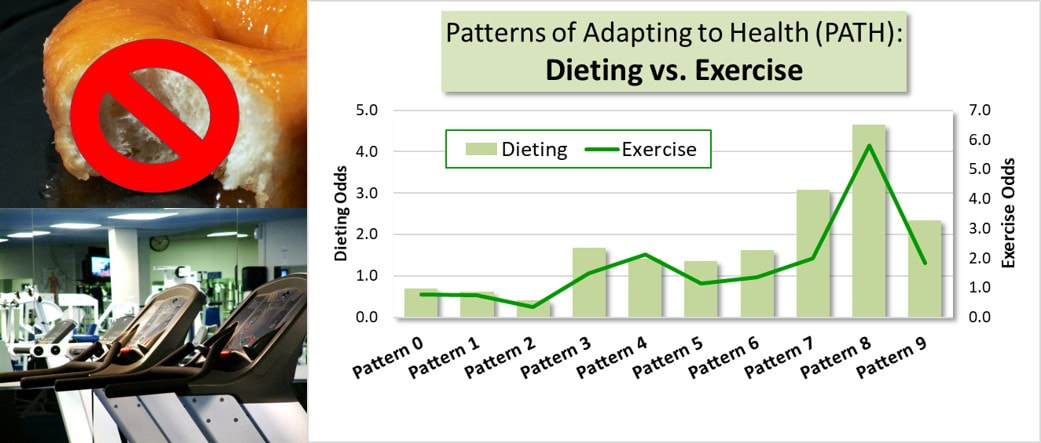
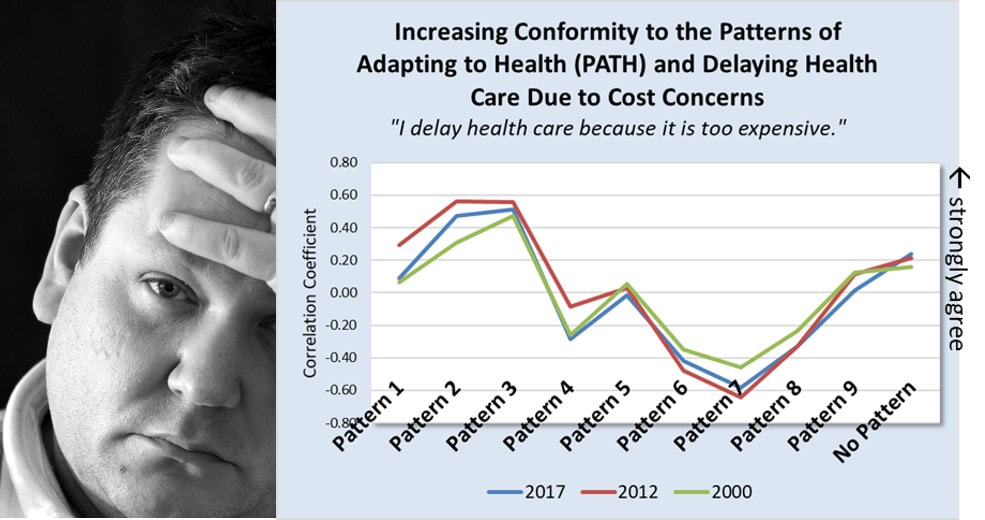
But why is dieting promoted far more often than exercise? The Patterns of Adapting to Health (PATH) offer insight into this question. The PATH show that adult health-related behavior conforms to predictable patterns rather than being entirely unique to each person. What this means is that health-related behavior options a person can actually choose is constrained by the behavior defined by their dominant pattern. Example The graph above looks at the odds of using dieting and/or exercise as a health promoting activity in a sample of over 2,000 adults. The odds of choosing dieting were greater than the odds choosing exercise for six of the nine patterns. Adults dominated by patterns 3, 5, 7, 8, and 9 were more likely to choose dieting over exercise. Adults dominated by Pattern 8 were the only ones with extremely high odds of choosing both. The PATH Effect This outcome is predicted by the patterns. All the PATH, with the exception of Pattern 8, are defined by lower levels of physical activity or exercise. In contrast, patterns 3, 5, 6 and especially patterns 7, 8 and 9 are defined by higher interest in healthy dieting. The result, is a much larger consumer market for dieting products versus exercise products. The PATH help explain why dieting products are promoted at a much higher rate than exercise products. Dieting is a health-related behavior option "allowed" by many more patterns while only one pattern, Pattern 8, allows high levels of physical activity or exercise. The PATH explain why the market is smaller for exercise products. More adults find it difficult to increase and maintain higher levels of exercise because their dominant PATH resist this behavior. It is only a realistic option for those adults dominated by Pattern 8. #diet #exercise #health #behavior #weightloss The Research. Three different studies across multiple years (2000, 2012, and 2017) and different adult populations showed that as adult’s health behavior is dominated by Patterns 1, 2, 3, and 9 their delay of health care due to worries about costs is strong. In contrast, as adult’s health behavior conforms to Patterns 6, 7, 8, and to a lesser extent Pattern 4, health care seeking is not delayed over concerns about the expense.
Conclusion. An adult’s increasing conformity to the nine Patterns of Adapting to Health (PATH) is a direct and stable predictor of his or her tendency to delay health care or not because of concerns about health care costs. Implications. In spite of the changing mechanisms of financing health care delivery over the past 17 years, a person’s decision to delay or not delay health care due to cost concerns have remained stable and reliably predicted by their dominant pattern of adapting to health (PATH), irrespective of changes in the actual costs themselves. Hospitals and health systems promote their diagnostic services as a strategy for early diagnosis and prevention, but also as a strategy to get potential patients in the doors.
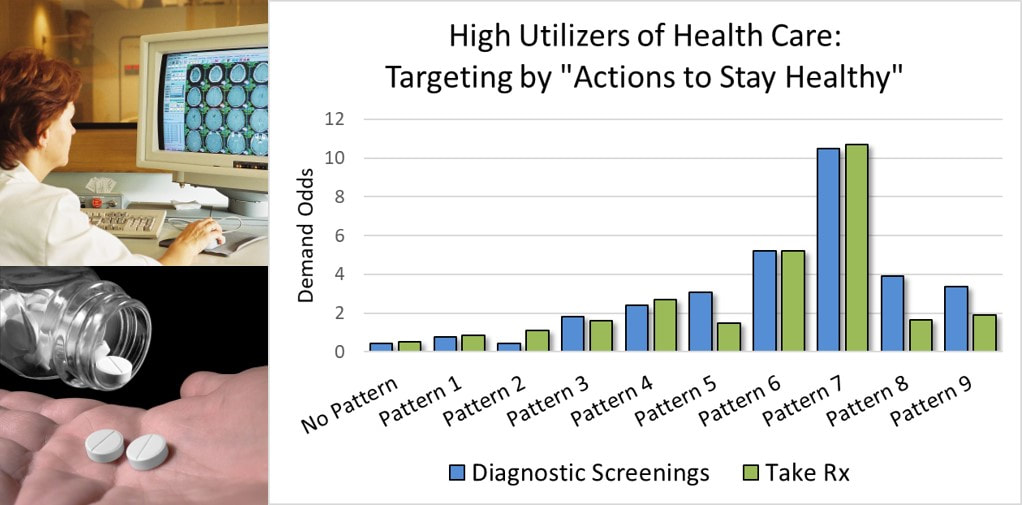
The fact is, only one segment of the adult population really considers diagnostic testing and prescription medications as critical to staying healthy: Adults conforming to Pattern 7 identified by the Patterns of Adapting to Health (PATH). These adults are consistently linked to the highest demand for both diagnostic testing and the use of prescription medications as health supporting activities. The tailoring and targeting of marketing promotions to adults with Pattern 7 offers a potentially higher return for health care and hospital marketers in two ways:
Patient satisfaction contributes to clinical outcomes, patient retention, fewer medical malpractice claims, and improved reimbursement. Unfortunately, most guidance given for improving patient satisfaction focuses on improving service delivery and staff-patient interactions. The guidance is basically - get better.
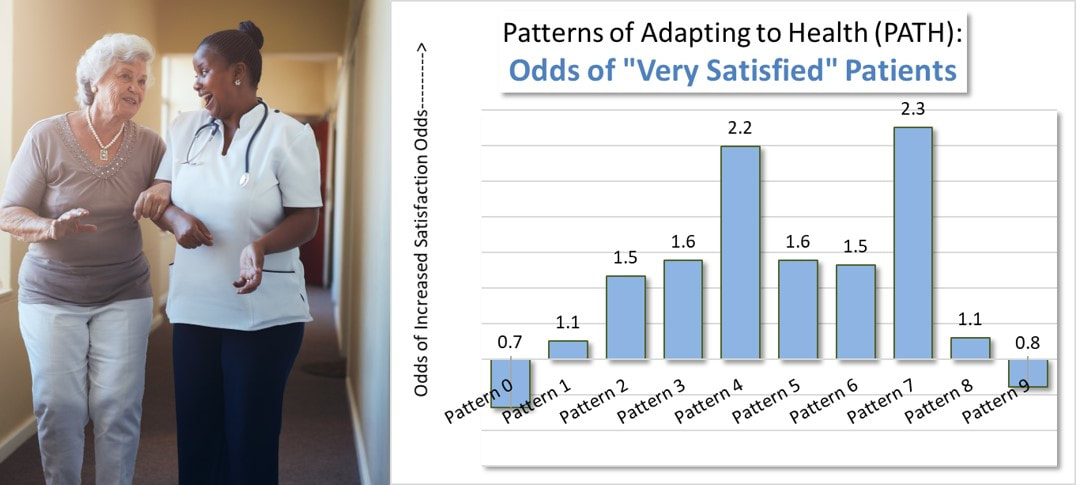
Health Behavior Patterns and Satisfied Patients. Research relating the Patterns of Adapting to Health (PATH) to patient satisfaction ratings over 10,000 patients found that patients dominated by two patterns, Pattern 4 and Pattern 7, had over two times greater odds of giving a “very satisfied” rating compared to patients dominated by the other patterns. It seems that patient satisfaction is determined both by the behavior and culture of providers as well as individual patient dispositions at least partially shaped by their health behavior pattern. Attracting Satisfied Patients. This gives health care providers another option for raising their patient satisfaction levels: Attract a higher number of patients dominated by Pattern 4 and Pattern 7. This is actually a viable strategy. Research over the past 30-plus years has confirmed that all nine Patterns of Adapting to Health (PATH) exist in every market within the U.S. Those providers that attract a higher rate of those Pattern 4 and Pattern 7 patients within their service areas will see patient satisfaction benefits. Implications. Many market research studies have confirmed that patient preferences for local hospitals can differ based on patient’s dominant health behavior pattern. Some hospitals may be unknowingly benefiting from attracting and admitting patients dominated by either Pattern 4 and Pattern 7. Other hospitals, on the other hand, may be suffering, relative to patient satisfaction, because of unknowingly admitting fewer of these patients. |
AuthorFrederick H. Navarro, PhD. Archives
March 2019
Categories |
|
Copyright © 2017 PATH Institute
|
Website by RyTech, LLC
|

 RSS Feed

