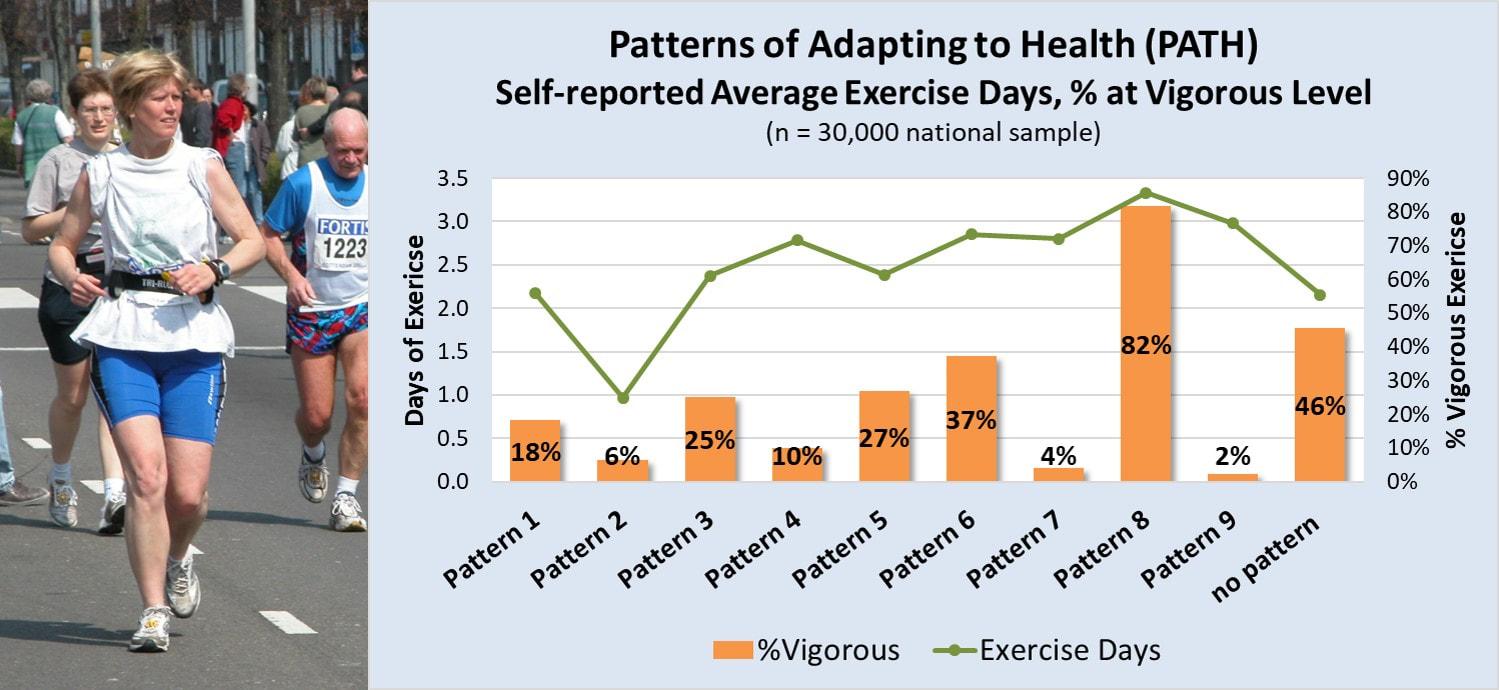
 Vigorous Physical Activity and Health. Regular vigorous exercise delivers more health and heart benefits than moderate level exercise (ref). According to the Physical Activity Guidelines for adults, vigorous physical activity can deliver the same health benefits as moderate level physical activity in half the time (ref). Yet, according to HHS, over 80% of adults don't meet any of the the physical activity guidelines (ref). So, who are the less than 20% of adults who DO meet or exceed the physical activity guidelines. Patterns of Adapting to Health (PATH) and Physical Activity. The Patterns of Adapting to Health (PATH) are nine quantifiable patterns of health-related behavior that exist in every region of the United States and govern the health behavior of large adult populations. These patterns, first discovered in the mid-1980s and tracked for the past 30 years, have consistently and reliably predicted a broad array of health-related outcomes, including levels of individual physical activity. For example, in a sample of 30,000 adults from across the U.S., an adult’s dominant PATH predicted both the number of days he or she exercised and the degree that exercise was at the vigorous, most health-promoting level. Adults dominated by Pattern 8, accounting for about 11% of adults, not only exercised more frequently than adults dominated by any other PATH, they also exercised nearly exclusively at the vigorous level. In contrast, adults dominated by Patterns 4, 7, and 9 reported nearly the same average days of exercise, but very rarely at the vigorous level. So, of the nearly 20% of adults who meet the Physical Activity Guidelines, those dominated by Pattern 8 accounted for over half of them. The smattering of the rest mostly came from Patterns 3, 5, and 6. Anti-Aging Benefits: Absence of Disease. Higher rates of engaging in rigorous or vigorous physical activity have been linked to anti-aging benefits such as increased longevity (ref) and lower rates of many different types of diseases (ref). We should therefore expect to see lower rates of illness among those adults who regularly engage in vigorous physical activity the most. In a recent on line survey of 2,000 adults that included information to examine them by their dominant PATH, this is exactly what was found. The survey asks adults to identify if they suffered from one or more of the following health conditions: diabetes Type 2, high cholesterol, GI problems, chronic back, greater than 20 lbs. overweight, joint pain, muscle pain, high blood sugar, high blood pressure, low energy, mood swings, sleeplessness, or emotional stress. The number of reported disease or health conditions were compared against the participant's dominant PATH and risk odds calculated, after controlling for age. The results were as expected. Adults who followed Pattern 8 were the only ones with statistically significant lower odds of suffering from any health condition or disease. In contrast, adults conforming to Patterns 2, 5, 6, 7, and 9 had statistically significant higher odds of suffering from multiple health conditions, while adults following Patterns 1, 3, and 4 suffered from disease or health issues at a rate consistent with the general sample. 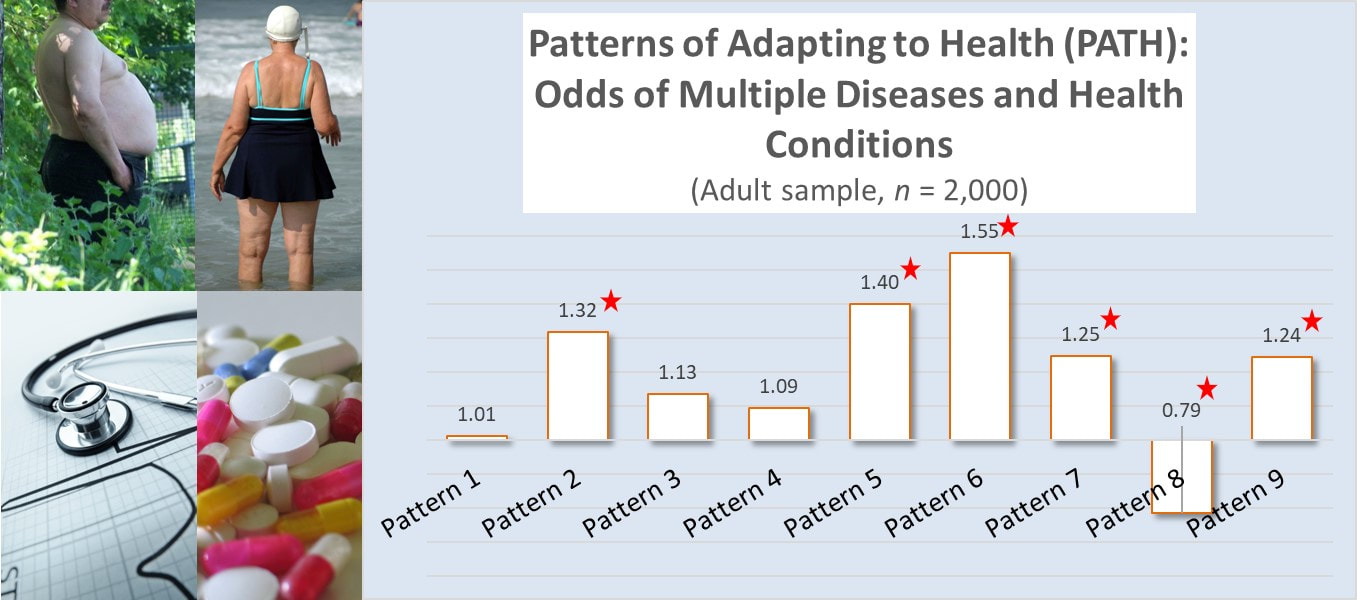 Consistent with other research, higher levels of regular vigorous physical activity deliver the most health benefits and reduce the impact of aging on disease risk.
More importantly, perhaps, is the realization that a specific pattern of health-related behavior, followed by a relatively fixed number of adults, accounts for the majority of those meeting the U.S. physical activity guidelines and reaping the associated health benefits.
0 Comments
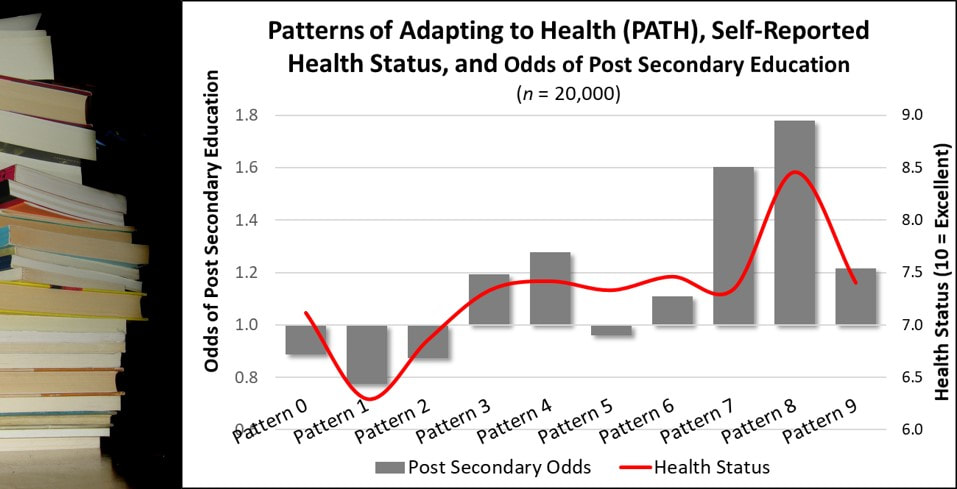 Education is a social determinant of health. Higher educational attainment, particularly post secondary education, is associated with better health.
But is that the whole story? Maybe not. Patterns of Adapting to Health and Health Status. In a sample of over 20,000 adults, those with Pattern 8 reported the highest health status (red line in graph), well above adults dominated by any other PATH after controlling for educational level. Patterns of Adapting to Health (PATH) and Achieving Post Secondary Education. In the same sample, the Patterns of Adapting to Health significantly predicted the odds of achieving post secondary education, with adults dominated by Pattern 7 and the high health status Pattern 8 adults showing the highest odds. Conclusion. Improved health associated with achieving higher education may be partially explained by the greater frequency of Pattern 8 adults among those reporting post secondary education experience. Implications. The strength of education as a social determinant of health needs further study. It may, in fact, benefit from the naturally higher health status of adults with Pattern 8 more frequently pursue and achieve higher education.  A 2012 national web-based survey of 1,900 adults found that 32% reported visiting a hospital website in the past year. Question: Are all these website visitors of equal value to hospitals in terms of revenue generation? To provide one answer, the hospital website visit data and actual hospital claims data was examined in relation to the Pattern of Adapting to Health (PATH). The hospital claims data came from health plan facility claims tracked for three years against the member’s dominant PATH. The facility claims were expressed in 2017 dollars in amounts below or above the overall average claims. 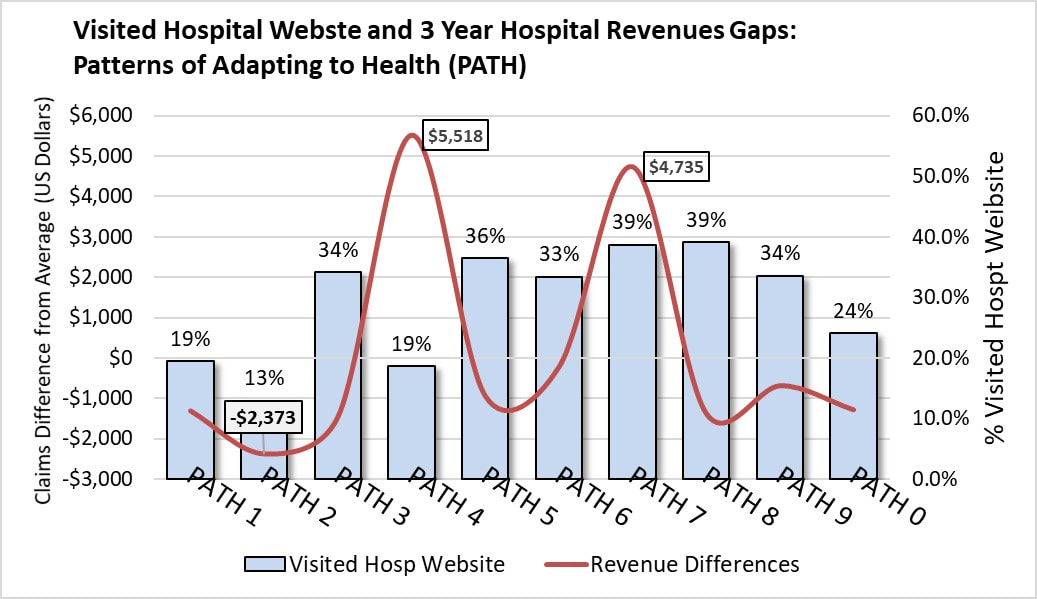 Adults dominated by six PATH had higher than average hospital website visits. Among these, only adults dominated by PATH 7 delivered higher value to hospitals in terms of billable insurance claims totaling $4,500 above the average per discharge over three years. Adults dominated by PATH 4 also brought in more patient care revenues but did so with below average hospital website visits. Adults dominated by every other PATH, even those reporting higher hospital website visits (PATH 3, 5, 6 and 8) generated below average hospital revenues.
Answer: It appears, based on this quick review, that all hospital website visitors cannot be considered equal in terms of their actual revenue value to hospitals. |
AuthorFrederick H. Navarro, PhD. Archives
March 2019
Categories

|

 RSS Feed
|
Copyright © 2017 PATH Institute
|
Website by RyTech, LLC
|